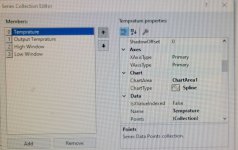
Only getting my first and last data series.
NTC_Tool_Graph.Series["Temprature"].Points.AddXY(lable, Temprature);
NTC_Tool_Graph.Series["Output Temprature"].Points.AddXY(lable, Program.Data_File.SimulationGraphData[loop]);
NTC_Tool_Graph.Series["High Window"].Points.AddXY(lable, High_error[loop]);
NTC_Tool_Graph.Series["Low Window"].Points.AddXY(lable, Low_error[loop]);
No matter what sets I comment out I get just the first and last Series to plot. Is there a control that I am not updating ?


