Hello.
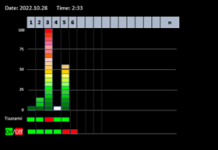
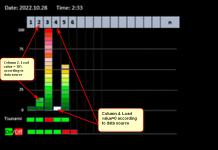
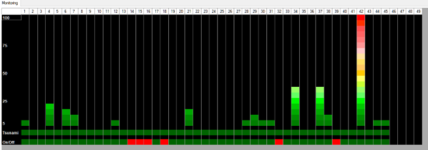
I am very new in C# and I need to make a monitoring system, that will show bars according to the table (from csv file that updated every minute). Example of the data that represented on attached picture:
2022.10.28 2:33
1 33 5 0
2 33 18 0
3 33 100 1
4 33 0 0
5 21 55 0
6
Could you please advise how better to perform this kind of bars (not so standard for charts, as it comprise of rectangular pieces each represents 5% of load). What libraries and what kind of techniques should I use to make it happen? I would appreciate to point me in the right direction, to give me links or even to create a prototype of the code if it is possible. So, that I will be able to work further and make it perfect. I will be glad to buy a cup of coffee to a consultant. Thank you in advance for your help.
Rost


